Dijkstra’s Algorithm Project (DAP-1)
Built to study implementations and applications of the Dijkstra’s Algorithm. Finds a topology that has the least cost of construction for paving streets to connect all houses in a town. Made with Python.
What it is
This project explores a problem known as the Muddy-Town problem. It presents a scenario where a group of houses require a set of roads to connect them to each other either directly or indirectly and we are required to find a topology of roads that fulfills the connection but also costs the least to build. A Depth-First Search strategy is what we use for this problem which also represents the core of Dijkstra's Algorithm. This program takes in the number of houses and roads as input then outputs the least cost to pave it and the topology it should follow.
Installation
The GitHub repository can be cloned from here. Python3 is required to be installed on the system.
Usage
Navigate to the project folder and open a terminal in it. To launch the application, type
> python3 townify.py
The first step is to input the problem in question which looks like a graph below:

Each bubble represents a house, the lines represent the interconnections and the numbers show the cost to pave each road. Not all houses are required to be connected to every other house; the topology can be totally random. But each house does require to be connected at least indirectly to every other house or else the algorithm fails. Dijkstra’s algorithm is primarily a graph traversing algorithm so any disconnected node from the topology won’t be registered into the problem. The next step is to encode it into a text format since this program only takes input and output in this format. For example, the graph above would be represented as:
“Town1”
10,”1”,”4”
1,”1”,”3”
7,”2”,”4”
6,”2”,”5”
14,”3”,”5”
3,”3”,”6”
1,”5”,”6”
The first line is the name of the town. Each line that follows represents one connection that consists of the cost, node1 and node2.
The whole process of drawing a graph and converting it into text format can be skipped by simply choosing (2)Generate Random Town in the main menu. It will ask for number of houses, number of streets and a seed for randomization. It will then generate a file (someNumber)Town.dat in the home folder.
You can view any town you made using the menu option (1)Load town and display town. Next, you use the menu option (3)Generate a minimum cost paving plan for a town to do as it specifies. This will generate a file (YourTown)PavingPlan.dat which contains the new topology of roads of the inputted graph along with the minimum cost for paving them. The menu option (4)Load and Display Paving Data and Paving Cost can be used to do as it specifies.
(5)Load a paving plan and test if its valid can be used to test whether a paving plan is rightfully the most minimum cost for the pavement.
How it works
We need to first define Dijkstra’s Algorithm in order to explain how DAP-1 works. Dijkstra’s Algorithm is a kind of Depth-First-Search algorithm that works on graphs whose interconnections contain specific weights. These weights can be distances of networked wires, cost of paving roads, time it takes to fly to different airports, etc. After choosing a single start-node, Dijkstra’s Algorithm finds an alternate topology of the inputted graph that would only include the interconnections that result in the shortest paths (smallest weights) from the start-node to every other node. This is the principle that DAP-1 uses to find the roads that would cost the least to build in total but still connect all houses in a town either directly or indirectly. The following picture shows the topology before and after this algorithm is applied on it.

The various steps of Dijkstra’s Algorithm is explained below.
- Make a list that keeps track of all nodes that have been visited. We called this visited_list and its currently empty.
- Choose a start node. Here, we will choose Node1.
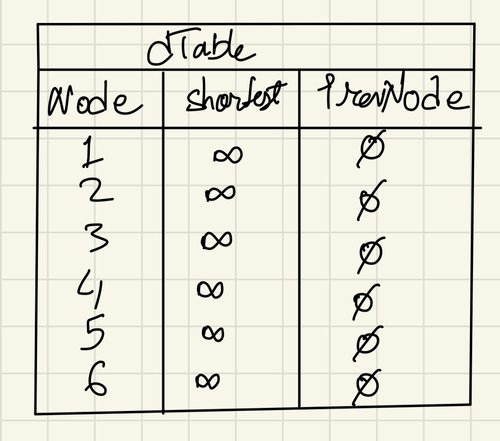
- Make a dTable that looks as follows:
 All the nodes have infinity as their start values for the shortest column and NULL for the prevNode column. The shortest value of a node indicates the total weight of the shortest path to this node from the start node. The prevNode value shows which node it comes from.
 - Set the shortest value of Node1 to zero.
- Check the dTable to see which node has the smallest shortest value and one that hasn’t been visited yet (i.e. not present in the visited_list). Call this node the currentNode. If no such node found, go to step 12.
- Find the list of neighbors of currentNode which have not been visited yet (i.e. they are not in visited_list).
- Find the sum of the shortest value of currentNode and the weight of the first neighboring node in the list. Call this value calculatedDistance.
- Check the dTable entry of this neighbor node. If the entry is infinity, replace this entry with calculatedDistance and set the prevNode entry to currentNode. If the entry is larger than calculatedDistance, replace this entry with calculatedDistance and set the prevNode entry to currentNode. If both conditions are false, do nothing.
- Add this neighboring node to the visited_list.
- Find the sum of the shortest value of currentNode and the weight of the next neighboring node in the list. If the list has been traversed, go to step 5.
- Do steps 8 to 10 for the remaining neighboring nodes in the list of neighbors of currentNode.
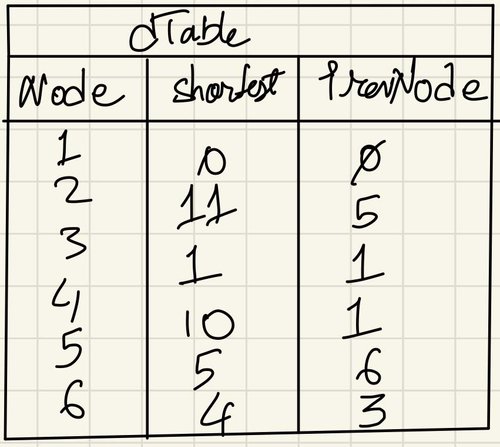
- The dTable we have in the end is the result of the Dijkstra’s Algorithm. The table looks as follows:

This final dTable can then be used to construct a new graph using the prevNode entry to determine the interconnections between the nodes. We then refer to the original diagram to obtain the specific weights of each connection resulting in a final graph that represents the shortest path from the start node to every other node and one with the least weights. For example, the path from Node1 to Node2 in the after picture above is 1-3-6-5-2 and the total weight that would cost us is 11. This total weight value is also stated in the dTable as the shortest value of this node.
Credits
The code in the file edgesCalc.py is derived from an external source.
Original Author: AnkitRai01
Code source: https://www.geeksforgeeks.org/check-if-a-directed-graph-is-connected-or-not/

